What Domains Are Selling Right Now? Insights from 113,408 Sales
DOMAIN MARKET REPORT
TL;DR
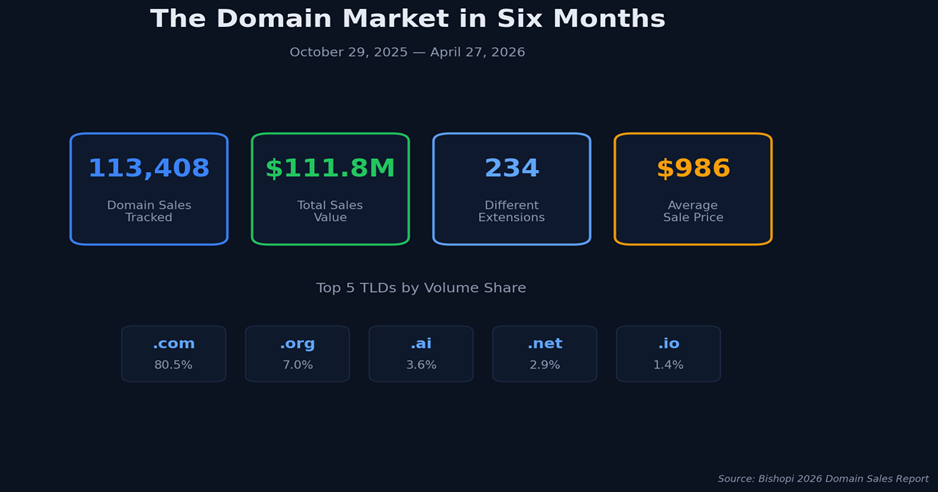
We pulled six months of public domain sales data, from October 29, 2025 through April 27, 2026, across the major aftermarket platforms. The dataset covers 113,408 transactions worth $111,829,996.07 across 234 different extensions. Here’s what the data says, in five lines:
|
The full breakdown — what’s winning, what’s collapsing, and what to do about it — is below.
What this report is
This is the first of Bishopi’s quarterly trailing-window domain market reports. Every 90 days we’ll refresh the dataset, the analysis, and the conclusions. This first edition covers the trailing 180 days ending April 27, 2026 — roughly four months of late 2025 and four months of 2026.
We chose a rolling window over a calendar-year report because four months of any given year doesn’t tell you what the market is doing right now. Six months of recent data does.
If you want to skip ahead:
How we collected the data
The 2026 market in numbers
Which TLDs are actually winning
The length sweet spot — how many characters should your domain be
The keywords quietly exploding
When domains actually sell
The marketplace landscape
What this means if you’re buying or selling right now
FAQ
Methodology
Citability matters when you’re publishing market data, so the methodology comes before the findings.
Data window. October 29, 2025 — April 27, 2026. Trailing 180 days, ending today.
Source. Aggregated public sales records from the major domain aftermarket platforms: GoDaddy, Sedo, NameJet, Afternic, DropCatch, Namecheap, Dynadot, Sav, SnapNames, BuyDomains. Bishopi’s Sales History database tracks roughly $3.37B in cumulative sales across 1,424 mediators historically; this report focuses on the recent six-month slice.
What’s excluded. Private brokered sales that aren’t publicly reported. Wholesale registrar transactions. Renewals. Anything that isn’t an aftermarket sale of an existing domain.
Trademark filter. We applied a manual screen to the emerging keywords list to remove well-known registered marks (automotive brands, sports clubs, consumer brands). The data may show a trademarked term selling at high prices — that doesn’t mean readers should buy domains containing it, because trademark holders routinely reclaim those names through UDRP. The screen is conservative; if a keyword is borderline, we noted it inline.
Refresh cadence. Quarterly. The next edition covers the May–October 2026 window and publishes at the end of July.
The Domain Market in Numbers
Six months of domain sales activity across the major aftermarket platforms.
Six months. 113,408 sales. $111,829,996.07. Average sale price $986. Median domain length 11 characters.
That last number — median length — surprises most people who haven’t looked at the data. The conventional wisdom says short domains sell. The data says short domains sell for more, but most actual transactions happen in the 7–15 character range. Length and price aren’t the same conversation.
The 4–10 character range alone accounts for 48.7% of total market value despite being only 47% of volume. That’s where the money is concentrated.
We’ll come back to length in detail. First, the TLD picture, because that’s where the most actionable patterns live.
Which TLDs Are Actually Winning Right Now
Most “best TLD” analyses lean on opinion. This one is just the data.
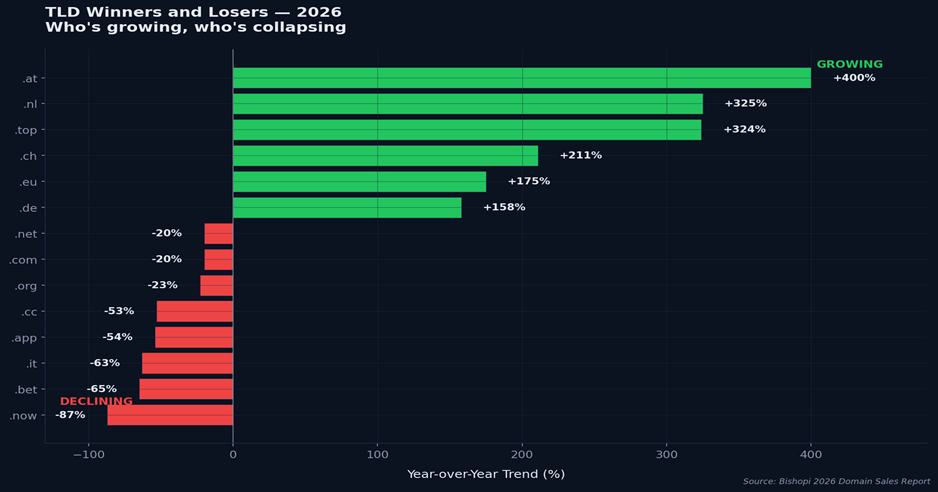
Year-over-year trend by TLD. Six TLDs are growing triple digits; eight are declining.
The volume leaders (where most transactions happen)
.com holds 80.5% of total volume at $960 average sale price. It’s still the gravity well of the domain market. But the trend line is clear: -20% year-over-year. .com isn’t dying — it’s just no longer growing at the same rate as the long tail. Most buyers still want a .com when they can get one. Most sellers still list .com first. The volume share won’t move much. The decline is in transaction velocity, not relevance.
.org is at 7.0% share, $978 average, down 23%. Following .com’s pattern.
ai is at 3.6% share, $1,708 average, holding stable. The volume story is interesting too: 98% of all .ai transactions clear on Namecheap, where they account for 16.2% of total inventory. .ai costs roughly 2x what an equivalent .com sells for on the same marketplace. AI as a category has built marketplace-specific liquidity that no other emerging TLD has matched.
.net is at 2.9% share, $895 average, down 20%. The classic backup TLD continues its slow fade.
.io holds about 1.4% share at roughly $990 average. The startup default is plateauing — neither growing nor crashing.
The premium tier (highest prices per sale)
These TLDs have small volume but command big prices when they do trade:
.xyz — $7,094 average, +549% above the cross-market average. The experimental brandable layer.
.gg — $5,665 average, +418%. Gaming and esports concentration.
.eu — $5,175 average, +373%. European expansion play, also showing strong growth trend.
.app — $3,285 average, +228%. Developer-focused, but pricing here is sticky while the trend is collapsing (-54% year over year). Read that one carefully: high prices on declining volume usually means the buyers who remain are paying up before the category tips over.
The hot growers (TLDs gaining momentum)
These aren’t dominant by volume yet, but they’re growing fast enough to track:
TLD | Year-over-year trend |
.at | +400% |
.nl | +325% |
.top | +324% |
.ch | +211% |
.eu | +175% |
.de | +158% |
The European ccTLDs are notable. Five of the six fastest-growing TLDs in the dataset are European country codes. Either there’s a structural shift toward localized domains in EU markets, or domain investors have collectively decided ccTLDs are undervalued. Probably both.
.top is the speculative wildcard. It’s a generic gTLD that costs almost nothing at registration and is showing 324% growth. The average price is still low — under $200 in most cases — but the volume is moving.
The TLDs to avoid
Some extensions are in genuine decline. The data is unambiguous:
.now — -87% year-over-year volume trend. Highest decline in the dataset. Pricing remains elevated for the few sales that do close, which is the same pattern we saw with .app: high prices, vanishing buyers.
.bet — -65%. Gambling regulation pressure shows in the numbers.
.it — -63%. The Italian ccTLD is collapsing despite Italy’s overall ccTLD-friendly market.
.cc — -53%. Long-tail backup TLD losing relevance.
If you’re building a portfolio for resale in the next 12–18 months, these four are the clearest “not now” calls in the dataset. The remaining inventory may close, but each transaction takes longer and the buyer pool is thinning.
For the full ranked breakdown of every TLD by investment score — including the use cases each one is best suited for — see our companion guide on the best domain extensions ranked by real sales data (publishing next week).
The Length Sweet Spot
How many characters should your domain be? The honest answer depends on what you’re optimizing for.
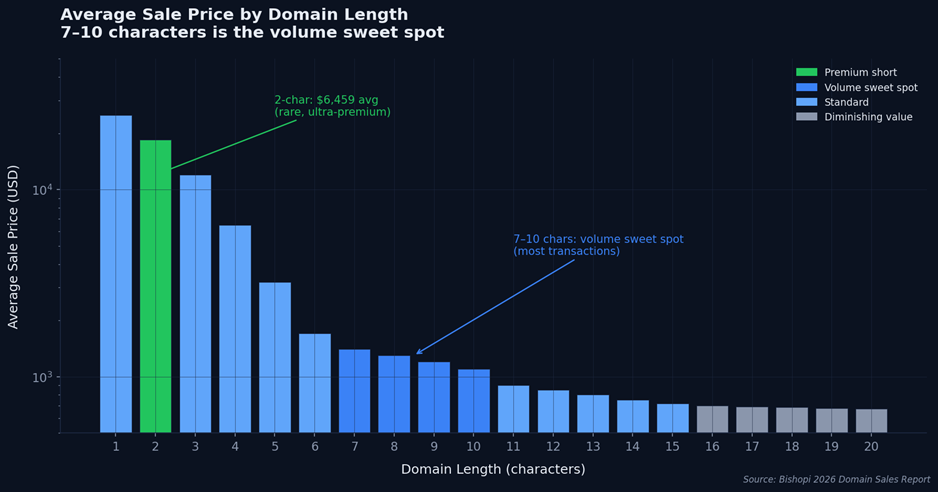
Average sale price drops roughly logarithmically as domain length increases.
If you’re optimizing for resale value
Shorter is better, but the curve is steeper than most realize. A 2-character domain averages $6,459 per sale in this window. By 4 characters that drops to roughly the same. By 6 characters you’re at $1,700. By 10 characters you’re under $1,100.
The drop is logarithmic, not linear. Each character you add roughly halves the price ceiling. Below 4 characters you’re in lottery-ticket territory — supply is essentially zero, and the few sales that happen are massive.
If you’re optimizing for actually transacting
The sweet spot is 7–10 characters. That’s where the volume is. A 7-character domain sells for an average of $1,400. A 10-character domain sells for $1,100. The price ceiling is lower, but the chance of an actual sale closing is dramatically higher.
For most builders — startups, SaaS founders, anyone shipping something rather than flipping — the practical answer is 7–10 characters. That’s the range where the buyer pool is deep enough that a fair price is reachable.
If you’re optimizing for budget
11–15 character domains sit in the $680–$700 average range, with much higher volume than the premium tier. That’s where most non-investor end-users actually buy. Long-tail keyword domains, descriptive names, and brandable mid-length names all live here.
What to ignore
16+ characters. The data shows diminishing pricing and diminishing volume above 15 characters. The market doesn’t reward length anymore — too many words, too hard to type, too obviously SEO-bait from a buyer’s perspective.
The takeaway: if you’re building, target 7–10. If you’re investing, target 4–6. If you’re hunting bargains, target 11–15. If you’re listing 16+, expect a long sit.
You can pull comparable sales by length and TLD using Bishopi’s Sales History tool to verify these patterns against your specific niche.
The Keywords Quietly Exploding
This is the most actionable section of the report. The keywords below are pre-pricing — meaning the trend is showing in transaction volume but the average sale prices haven’t fully adjusted yet. That window of opportunity is short.
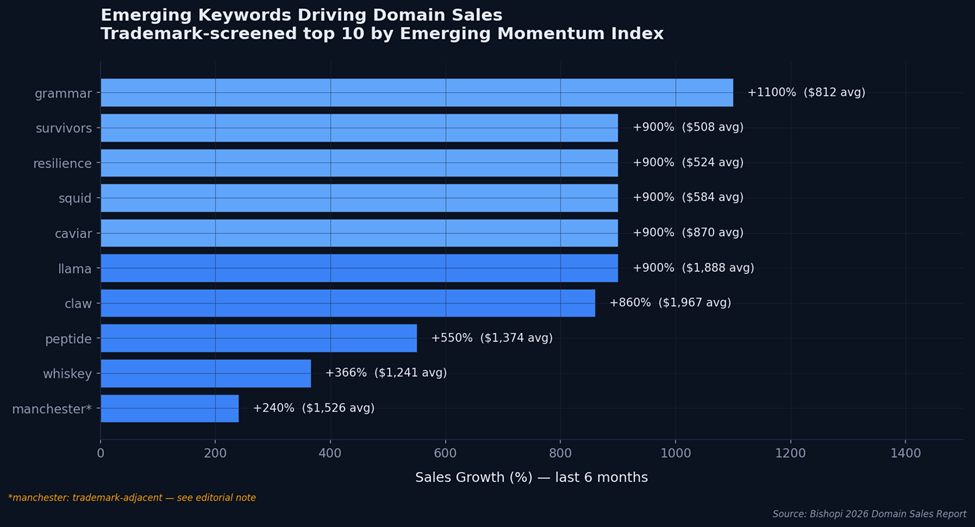
Trademark-screened top 10 emerging keywords, ranked by Emerging Momentum Index.
The list is screened for trademark exposure. Several high-momentum terms — automotive brands, major sports franchises, consumer goods — were excluded because acquiring those domains exposes the buyer to UDRP (Uniform Domain-Name Dispute-Resolution Policy) reclamation. Just because the data shows a trademarked term moving doesn’t mean it’s an investable trend.
Top 10 trademark-screened by Emerging Momentum Index:
Keyword | 6-month growth | Avg sale price |
grammar | +1,100% | $812 |
llama | +900% | $1,888 |
claw | +860% | $1,967 |
caviar | +900% | $870 |
squid | +900% | $584 |
resilience | +900% | $524 |
survivors | +900% | $508 |
peptide | +550% | $1,374 |
whiskey | +366% | $1,241 |
manchester* | +240% | $1,526 |
* On manchester: the keyword is borderline. Generic geographic uses (real estate, local services, restaurants in the city) are defensible. Football-club-adjacent uses are not — Manchester United and Manchester City both actively defend their marks. Treat this entry with caution and avoid any name that could plausibly be confused with the clubs.
We also excluded the keyword aids from the headline list despite strong momentum. The 11 sales averaging $453 in the data are almost certainly legitimate “hearing aids,” “first aid,” or “visual aids” registrations — assistive-technology and health-adjacent domains. We didn’t want a list-leading entry that needed a paragraph of context to interpret correctly. The data is real; the framing is the problem.
Why these keywords matter
Three patterns are doing most of the work in this list:
AI-adjacent biotech is showing up in llama and peptide. Llama (the AI model family) and peptide (precision medicine, GLP-1 adjacencies) both reflect categories where domain registrations are tracking ahead of mainstream commercial launches.
The premium pricing on llama ($1,888 average) suggests sophisticated buyers — most likely AI startups locking in branded properties.
Cultural moments are surfacing in claw, squid, and survivors. Streaming entertainment IP overlap is the most likely driver. These categories tend to spike around specific show or game launches and then fade. They’re harder to time but offer fast turnover when caught early.
Wellness and lifestyle are driving resilience, whiskey, and caviar. Premium consumer categories where domains are being acquired ahead of e-commerce launches. The pricing is moderate but the volume growth is consistent.
If you’re working from the data side, Bishopi’s Domain Trends tool and Fresh Drops feed surface emerging keyword patterns in close to real time. The trick is catching these patterns 30 days before they’re priced in. After that, the registrations are gone and the resale market hasn’t yet ramped — the worst window to enter.
When Domains Actually Sell
Most sellers list and forget. The data says timing materially affects both the speed and price of a transaction.
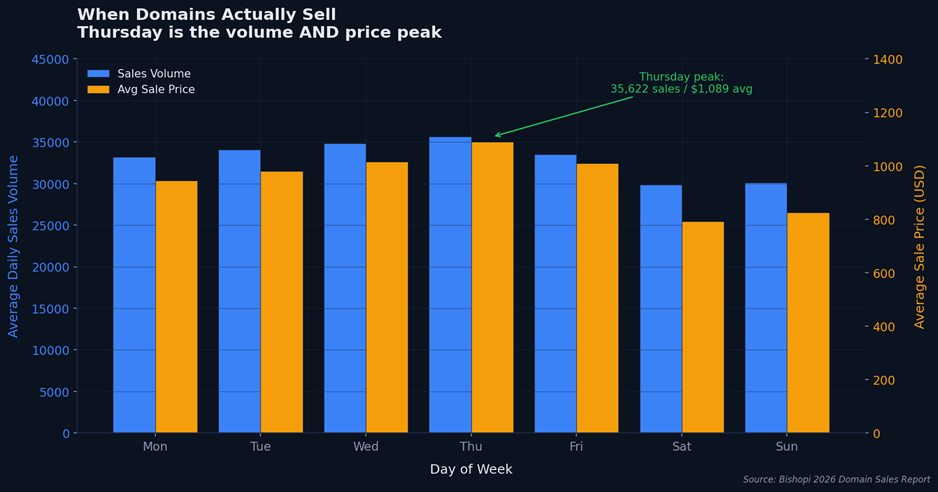
Daily sales volume and average price across the week. Thursday is both peaks.
Best day to list: Thursday
Thursday averages 35,622 sales per day and $1,089 average sale price. It’s the volume peak AND the price peak in the dataset. There’s no obvious mechanical reason for this — it isn’t billing-cycle driven, it isn’t tied to specific marketplace promotions — but the pattern holds across all six months in the window.
Worst day: Saturday
Saturday averages 29,843 sales and $792 average. Lowest volume, lowest price. Sunday is similar.
The weekend-to-weekday volume ratio is 0.87. That’s a meaningful drop, and the price drop is bigger — Saturday’s $792 average is about 27% below Thursday’s $1,089. If you’re listing a domain you genuinely care about selling well, don’t push it live on Friday afternoon.
Best months: October, November, June
October and November are the year’s volume peaks. Domain investors call this the Q4 push — end-of-year budget buyers, marketing teams locking in domains before annual planning, brand acquisition teams clearing pipelines. June is the second peak, likely driven by summer-launch SaaS and pre-back-to-school buying.
Slowest months: January, February, April
January and February are post-holiday troughs. April is the soft spring window before the June pickup. If you’re building inventory to flip, the summer months are when you’re acquiring; October–November are when you’re selling.
The actionable summary: list on Thursday, plan inventory pushes for October.
The Marketplace Landscape
Where you list materially affects what you’ll earn. The data shows a clean split between marketplaces optimized for volume and marketplaces optimized for price.
Marketplace | Volume share | Avg sale price | Specialty |
GoDaddy | 64.59% | $778 | Volume / .com |
Namecheap | 21.01% | $611 | .ai (16% of inventory) |
DropCatch | 11.97% | $700 | Expired .com |
Afternic | 2.01% | $3,879 | Premium brandables |
Sedo | 0.43% | $13,916 | Premium / international |
Read that table again. GoDaddy and Namecheap together handle 86% of all aftermarket transactions. But, at very different price points and inventory mixes. The same .com domain sells for $748 average on GoDaddy versus $485 on Namecheap. Sedo handles less than 1% of transactions but commands a $13,916 average sale price. They’re the premium-only specialist, where six and seven-figure deals close.
The most surprising finding: Namecheap is quietly the .ai marketplace. 16.2% of all Namecheap sales are .ai domains, and 98% of all .ai transactions in our dataset went through Namecheap. If you’re selling an AI-themed name, the data says list there first — the buyer pool is concentrated in a way no other marketplace matches.
For a deeper breakdown of which marketplace fits which domain type, including the verified 2026 commission structures (which differ significantly between platforms), see our companion guide How to Sell a Domain in 2026 (publishing in two weeks).
What This Means If You’re Buying or Selling Right Now
The market in April 2026 has a specific shape, and the practical implications differ depending on which side of a transaction you’re on.
If you’re buying
Volume is down 6.5% year-over-year, but prices are up 22%. That isn’t a buyer’s market — it’s a quality-over-quantity market. Sellers are holding firm because their inventory is concentrated in fewer, better names.
Where the actual bargains live: declining TLDs that still have practical utility. .net at $895 average is meaningfully cheaper than .com for projects where the brand isn’t going to live or die on the extension. .info, despite its reputation, transacts at very low average prices for descriptive long-tail names where SEO is the only goal.
Don’t chase the emerging keyword list at registration prices that feel high. By the time peptide is hitting $816 average resale, registrations of related names are already moving above retail. Either you registered last quarter, or you’re paying retail-plus.
If you’re selling
Premium pricing is holding. Don’t underprice. The market isn’t punishing sellers who hold the line on $X,XXX list prices for 8-character .com names — those names are still moving at the average.
The mechanical advice: list on Thursday. Plan your inventory push for October. Use Sedo for anything above $5,000. Use GoDaddy for everything else.
If you have a portfolio mostly in declining TLDs (.now, .bet, .it, .app), this is the moment to mark inventory down. The data trajectory says wait too long and the buyer pool gets thinner faster than the price ceiling drops.
If you’re investing
The market is structurally stable with bullish price momentum and bearish volume momentum. That’s a quality market — fewer, better deals.
Three concrete plays the data supports:
• .ai stays premium. It’s not declining and the average price is holding. Best for buy-and-hold against AI category growth.
• .top is the speculative growth bet. Cheap at registration, +324% trend, unproven upside. If you’re allocating speculative capital, this is where the asymmetry lives.
• European ccTLDs (.de, .nl, .ch, .eu, .at) are quietly growing. Less speculative than .top, more growth than .com. If you have any geographic angle for resale, these belong in the portfolio.
What to avoid: .now, .bet, .it, .app, .cc. The trend lines are negative and accelerating.
What’s Next
This is the first quarterly edition. The May–October 2026 window publishes at the end of July, and we’ll track which of the patterns above held and which didn’t. The full annual retrospective publishes in January 2027.
If you want to work with the underlying dataset — filter by TLD, length, keyword, price range, mediator — Bishopi’s Sales History tool gives you direct access to the same data that powered this report. It covers more than 6 million historical sales going back over a decade, not just the trailing six months we analyzed here.
For pattern-spotting on emerging keywords specifically, Domain Trends and Fresh Drops surface what’s gaining momentum 30 days before it’s priced in.
FAQ
What’s the average domain sale price in 2026?
The average sale price across 113,408 transactions in our six-month window (October 2025 — April 2026) is $986. Average prices have risen approximately 22% year-over-year despite transaction volume declining 6.5% — buyers are paying more per domain, less often. The median sits below the average because a small number of high-value sales pull the mean upward.
Which TLD has the highest average sale price?
Among extensions with statistically meaningful volume, .xyz leads at $7,094 average, followed by .gg at $5,665, .eu at $5,175, and .ai at $1,708. Some niche TLDs show higher per-sale averages but on too few transactions to draw conclusions from. .ai had over 3,300 sales in the window. This is the highest-volume premium extension and one heavily concentrated on Namecheap.
What domain length sells for the most money?
Two-character domains average $6,459 per sale, the highest in the dataset, but they’re rare — fewer than a hundred 2-character sales in the window. The volume sweet spot is 7–10 characters at $1,100–$1,400 average. The 8-character bucket alone drove $11.16M in total value during the window, more than any other length category.
Are .com domains still worth buying in 2026?
Yes, but the dynamics have changed. .com still holds 80.5% of total transaction volume and remains the most trusted extension globally. However, the trend is declining at -20% year-over-year, and .ai is commanding premium pricing for AI products that previously would have defaulted to .com. For most projects, .com is still the strongest choice. For AI-specific products, .ai is now justifiable at a premium.
What’s the best day of the week to sell a domain?
Thursday. The data shows 35,622 average sales per day on Thursdays at $1,089 average sale price — the volume peak and price peak of the week. Saturday is the weakest day, with about 29,843 average sales at $792 average price. Listing a serious domain on a Thursday rather than a weekend can affect both speed-to-sale and final price.
Sevak Mardirosian is the founder of Bishopi, a domain and SEO research platform tracking over 6 million historical domain sales. This report is updated quarterly. The next edition publishes at the end of July 2026.
Have questions about the data or methodology? Contact us.
Originally published at: bishopi.io
Get updated with all the news, update and upcoming features.