How to Spot a New TLD Bubble Before It Bursts
On 30 April 2026, ICANN opened the application window for its New gTLD Program, the second such round in history, and the first major expansion of the internet's namespace in over a decade. The window closes on 12 August. The last round, back in 2012, produced more than 1,200 new extensions, from .app and .shop to .london and .google. Some of those became durable businesses. Many became cautionary tales. A fresh wave is now coming, and most of the new strings won't even be delegated until late 2027, which means investors will be asked to make bets on extensions with no sales history at all.
That is exactly the moment a filter is most valuable. The problem with most TLD advice is that it tells you what sold, it ranks extensions by past transaction volume and calls it a day. But a leaderboard tells you nothing about what survives. The useful question for an investor isn't “which TLD had the most sales last quarter,” it's “which TLDs are real demand, and which are speculation that hasn't popped yet.” Every bubble-tier extension leaves the same fingerprint in the data before it collapses. This article hands you a repeatable, five-signal test to read that fingerprint yourself.
The five signals, in one box
Signal | What it tells you |
1. Registration-decay curve | Bubbles spike in the first ~2 months after launch, then bleed forever. Healthy TLDs climb or plateau high. |
2. Price up, volume down | Rising average price on falling volume is often the cheap end dying, not strength. Read price next to volume, never alone. |
3. Renewal survival | Registrations are vanity; renewals are revenue. A spike that erodes at year one is churn, not adoption. |
4. Registry & governance risk | A TLD is only as durable as its operator. Compliance actions and cheap-promo dependence are structural red flags. |
5. End-user vs. investor demand | Real businesses building on the extension = signal. Every buyer being another speculator = a closed loop waiting to pop. |
None of these requires insider access. Each can be checked in a few minutes with public registration data and a sales-history tool. Here's how each one works.
Why a sales ranking isn't an investment thesis
Sales rankings are backward-looking by construction. They capture extensions that already cleared the market, which is useful for pricing a name today, but silent on whether the extension will still have buyers in three years. Worse, a ranking can actively mislead: a TLD can post a rising average sale price precisely because it's dying, as the low end of the market disappears faster than the top. Our own data studies — the analysis of 113,408 recent domain sales and the breakdown of 480,667 .com sales — rank what sold. This piece is about what survives. The five signals below all share one property that a leaderboard lacks: they describe the shape of an extension's lifecycle, not its position on a chart. That's what separates a real namespace from a speculative one.
Signal 1 — The registration-decay curve
Healthy extensions grow registrations steadily or plateau at a high level. Bubble extensions spike in the first two months after launch, then decline permanently and never recover.
This is the master signal, because it's the hardest to fake and the earliest to appear. The clearest documented example comes from geographic TLDs. An analysis by the registrar OpenSRS found that, with a few exceptions, geoTLDs such as .amsterdam and .london booked more than half of their entire lifetime registrations within the first two months after launch — and that things did not improve after the twelve-month mark. The pattern was a launch spike followed by a permanent slide. Compared against a balanced book of non-geographic TLDs over the same window, the difference in curve shape was stark: one was front-loaded and bleeding, the other was distributed and stable.
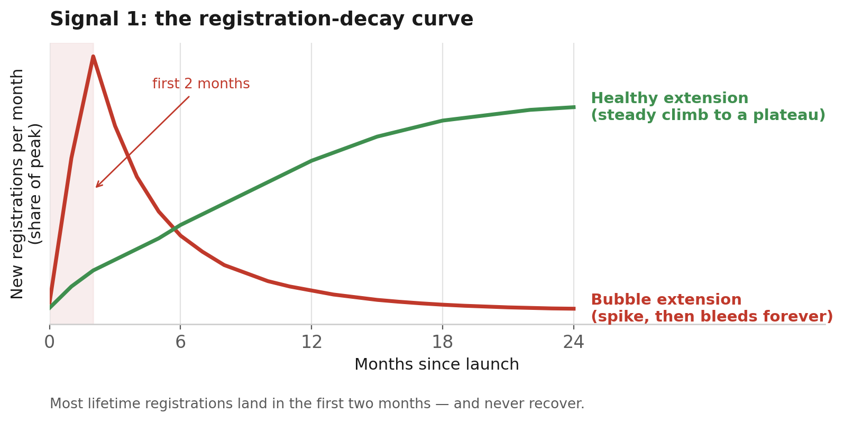
Figure 1. The registration-decay curve. A bubble extension books most of its lifetime registrations in the first two months, then declines permanently; a healthy extension climbs steadily to a high plateau. The shape of the curve, not the size of the launch, is the signal.
That shape is the tell. A spike-then-bleed curve means the demand was speculative or novelty-driven, people registered names because the extension was new, not because they needed them, and once the novelty passed, so did the buyers. A steady climb or a high plateau means real, recurring demand.
There's an important nuance that keeps this signal honest: not every geoTLD is dead. Amsterdam's city extension is frequently cited as one of the most successful in the world relative to the size of its city and economy, because Amsterdam businesses actually use it. The decay curve isn't a verdict on a category, it's a verdict on a specific extension's demand. A geo that real local businesses adopt breaks the pattern, which is exactly why this signal connects to Signal 5 later on.
How to check it: pull the extension's registration timeline on a public stats source such as nTLDStats and look at the shape over its full history. Spike-then-bleed is a warning. A steady climb or sustained plateau is real demand. On the resale side, Bishopi's Domain Trends tracks sales momentum and trajectory by extension — the resale mirror of the registration curve.
Signal 2 — Price up, volume down (the distribution trap)
A rising average sale price looks bullish, but is often mechanical: when the cheap end of a market dies faster than the rest, the average rises even as the extension shrinks.
This is the signal that catches investors who read only one number. Average sale price is seductive because “prices are up” sounds like strength. But an average is a ratio, and it can climb for the worst possible reason — the low-priced transactions vanishing. .app is the textbook case in recent data: its average sale price ran well above the broader market while its transaction volume fell sharply year over year. Buyers were paying more for fewer names — the signature of a category tipping over, not one on the rise.
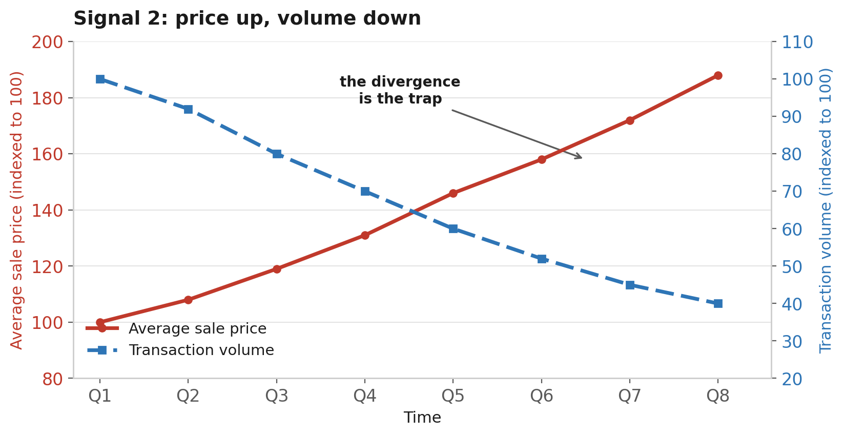
Figure 2. The distribution trap. When average sale price rises while transaction volume falls, the average is often climbing because the cheap end of the market is dying — not because the extension is gaining strength. The divergence between the two lines is the warning.
The discipline this signal teaches is simple: never read price without volume next to it. Price up and volume up is genuine strength. Price up while volume falls hard usually means the market is thinning from the bottom, and the buyers still paying are the last ones in. To check it, compare the extension's average-price trend against its transaction-volume trend over the same period in a sales-history tool — the same comparable-sales discipline from our guide to pricing a domain with comparable sales. Divergence — price climbing as volume drops — is the trap.
Signal 3 — Renewal survival
Registrations are vanity; renewals are revenue. A bubble extension is bought cheap on promotion and dropped at year one. Long-term zone stability signals an extension people actually use.
New registrations are the number registries love to put in press releases, and they're the easiest to inflate, a free or one-dollar first-year promotion can manufacture a registration spike overnight. The number that actually matters is whether anyone keeps those names. A domain bought for a dollar and dropped twelve months later was never demand; it was a discount being arbitraged.
Exact renewal rates aren't always public, but the signal is still readable: look at the extension's total zone size across multiple years rather than its launch numbers. A one-time spike that erodes back down is churn. A zone that holds or grows after the first renewal cycle is adoption. The conceptual tell is the same as Signal 1's curve, viewed a year out, does the spike survive contact with the first renewal invoice, or not?
This is also where promo-dependent extensions expose themselves. If an extension can only move volume by perpetually discounting the first year, it isn't building a base of users, it's renting a registration count that resets every twelve months. That's a structural weakness, and it leads directly into the next signal.
Signal 4 — Registry and governance risk
An extension is only as durable as the company running it. Registry instability, ICANN compliance actions, and fire-sale promo dependence are structural red flags that a sales chart won't show you.
.top is the instructive case, because on a pure trend chart it looks like a winner — it's the second-largest new TLD by registrations, with nearly five million names. But the registration count masks real governance baggage. In July 2024, ICANN issued .top a formal Notice of Breach of its registry agreement, citing failures to act on DNS-abuse complaints, non-compliance with rapid-suspension requests, and unpaid fees. The registry didn't cure the breach until 2 June 2025 — nearly a full year later.
And the underlying problem wasn't cosmetic. Independent security researchers found that .top accounted for just under 5% of all domains used in malware campaigns in 2025 — second only to .com and .net combined — and Spamhaus reported in May 2025 that abuse on the extension had actually worsened by roughly 50% over the prior six months, even after the ICANN notice. This is the perfect illustration of the signal: rapid registration growth, built on cheap registrations, masking a governance profile that makes the extension a liability. A name on a troubled extension can be devalued by association no matter how good the string is.
How to check it: search the registry operator's name alongside “ICANN breach” or “notice of breach,” note who the backend operator is, and watch for dependence on perpetual promotional pricing. A registry playing fast and loose with abuse, or one that can only grow on discounts, is carrying risk that won't appear in any sales ranking. The same reputation-and-history scrutiny applies at the individual-name level — see our domain history check and portfolio-vetting framework.
Signal 5 — End-user vs. investor demand
The healthiest signal of all: real businesses building on the extension, not just investors flipping names to other investors. An extension where every buyer is another speculator is a closed loop waiting to pop.
.ai passed this test in a way few speculative extensions do, by attracting genuine end-user buyers willing to pay serious money for brand assets. Names like genesis.ai (reported around $400,000), free.ai (around $350,000), and bot.ai (reported north of $1 million) went to operating companies building products, not to investors parking inventory. When real businesses compete for names on an extension, that's demand with a floor under it. Our analysis of 3,651 .ai sales shows this split in detail: the speculative low end is fading while the premium tier holds.
Contrast that with an extension where the sales record is a merry-go-round of investor-to-investor flips and the live sites are parked pages. That's a closed loop: value circulates among speculators with no end-user demand underneath, and it holds only as long as the next speculator believes. When that belief fades, there's nothing to catch the fall.
How to check it: scan recent sales for end-user buyers rather than known investors, and spot-check whether the top sales on the extension resolve to real, developed websites or to parking pages. Developed sites and operating-company buyers are the strongest signal an extension is real. Wall-to-wall parking is the opposite.
Putting it together: what the signals say about five extensions
Applying the five signals to extensions already in the data makes the method concrete. The verdicts below are directional reads of what the signals indicate — not financial advice, and worth re-checking against live data before you act, because trajectories move. Treat them as worked examples of the framework, not buy tickets.
Extension | Signal read | What the data suggests |
.ai | Passes Signals 4–5 (premium tier) | Real end-user demand from operating companies. Treat the speculation tier and the premium tier as separate asset classes. |
.app | Fails Signal 2 | High average price on collapsing volume — the classic distribution trap. Momentum favors exiting, not entering. |
.top | Signal 1 up, Signal 4 risk | Fast growth, but cheap-registration-dependent and carrying a documented ICANN-compliance and abuse history. Speculative; size positions accordingly. |
EU ccTLDs (.de / .nl / .eu) | Lean pass on Signal 5 | Localized end-user utility and steady adoption. Lower-variance than single-gTLD speculation where there's a geographic resale angle. |
Geo gTLDs (.london, etc.) | Fails Signal 1 (with exceptions) | Textbook spike-then-decay registration curve. The cautionary archetype — though a few geos with real local adoption, like .amsterdam, break the pattern. |
Notice that no extension is judged on a single signal. .top looks strong on growth and weak on governance; .ai splits cleanly into two asset classes. The framework's value is that it forces you to read an extension across all five dimensions, which is precisely what a one-number ranking can't do.
What this means for the 2026 round
Here's the catch with the incoming wave: two of the five signals need time to register. A brand-new extension delegated in late 2027 has no multi-year registration curve (Signal 1 needs history), no renewal cycles to survive (Signal 3 needs a year minimum), and no sales record to read price-against-volume (Signal 2 needs transactions). For genuinely new strings, you're working with the three signals that don't require a track record:
Signal 4 (registry and governance) is available on day one — you can see who the operator is, what their backend is, and whether they have a compliance history on other extensions before you commit a dollar. Signal 5 (end-user vs. investor demand) shows up early too — watch whether the first buyers are operating companies building products or investors parking inventory; the composition of the earliest sales is a leading indicator. And a real-time read of Signal 1 is possible within months — you can watch the launch curve form and ask whether it's spiking-then-bleeding or building, well before a full year of data exists.
The 2026 round will produce strings that genuinely matter and strings that are speculation dressed as opportunity. The extensions worth your capital will be the ones run by credible registries, adopted by real businesses, and building rather than spiking. The framework doesn't change for new TLDs — you just lean on the signals that don't need a history, and you wait for the rest to fill in before you size up.
Frequently asked questions
Are new TLDs a good investment in 2026?
Some are; most aren't. The category is too broad to answer at the level of “new TLDs.” The useful question is per-extension: does this specific TLD show real demand (steady registrations, surviving renewals, end-user buyers, a credible registry) or speculative demand (a launch spike that bled out, promo-dependent volume, investor-to-investor flips)? The five signals in this article are how you tell the two apart. Treating “new TLDs” as a single asset class is the mistake.
Which domain extensions should I avoid?
Avoid extensions that fail the structural signals: a spike-then-decay registration curve (Signal 1), rising prices on falling volume (Signal 2), registration counts that only hold up on perpetual discounts (Signal 3), a registry with a compliance or abuse history (Signal 4), or a sales record made up entirely of speculators flipping to each other with no developed sites underneath (Signal 5). An extension that trips several of these is carrying risk a sales ranking won't show you.
Do new gTLDs hold their value over time?
It depends entirely on whether the extension develops real end-user adoption. The ones that hold value are those where businesses actually build — recurring registrations, surviving renewals, developed websites, operating-company buyers. The ones that don't are those where demand was novelty-driven and faded once the extension stopped being new. The 2012 round produced both outcomes from the same starting line, which is the whole reason a per-extension test exists.
How can I tell if a TLD is a speculation bubble before it pops?
Read the registration-decay curve first — it's the earliest and hardest-to-fake signal. A bubble extension books most of its lifetime registrations in the first couple of months and then declines without recovering. Layer on the other four signals (price-vs-volume, renewal survival, registry governance, and end-user vs. investor demand) and a clear picture emerges before the collapse shows up in average sale prices. By the time a falling price confirms a bubble, you're late.
Why does the registry behind a TLD matter for investors?
Because an extension's durability and reputation depend on its operator. A registry that fails to act on abuse can earn the whole extension a bad reputation — .top's year-long ICANN breach and elevated malware association are the clearest recent example. A name on a troubled extension can be devalued by association regardless of how good the string itself is, and registry instability is a risk that never appears on a sales chart. Checking the operator before you buy is cheap insurance.
Run these checks before you buy
The five signals all come down to reading an extension's trajectory rather than its leaderboard position — and that's exactly what trajectory data is for. Bishopi's Domain Trends tracks sales momentum and direction by extension, and Sales History lets you check price against volume and see whether buyers are end users or investors — the resale-side reads behind Signals 1, 2, and 5. Before you commit capital to any extension, new or established, run it through the framework. A few minutes of trajectory and governance checking is the difference between buying real demand and buying someone else's exit.
The 2026 round opens a namespace expansion the internet hasn't seen in over a decade. Most of the noise will be speculation. The signal — the extensions actually worth owning — will be readable in the data, if you know which shapes to look for.
Related reading
→ We Analyzed 113,408 Domain Sales — What's Actually Selling Right Now — the TLD-by-TLD sales ranking this framework complements
→ Has the .ai Domain Boom Peaked? Yes — But Only at the Bottom (2026 Data) — the premium-vs-speculation split, worked on one extension
→ What 480,667 .com Sales Reveal About the 2026 Domain Economy — the legacy-TLD end of the risk spectrum
→ How to Vet a Domain Portfolio Before Buying — the name-level version of Signals 4 and 5
→ Domain History Check: What to Look for Before You Buy — checking a specific domain's past before you commit
→ How to Price a Domain Using Comparable Sales — the comparable-sales discipline behind Signal 2
→ Premium Domains: Are They Worth the Price? — when a premium extension earns its premium
Originally published at: bishopi.io
Get updated with all the news, update and upcoming features.